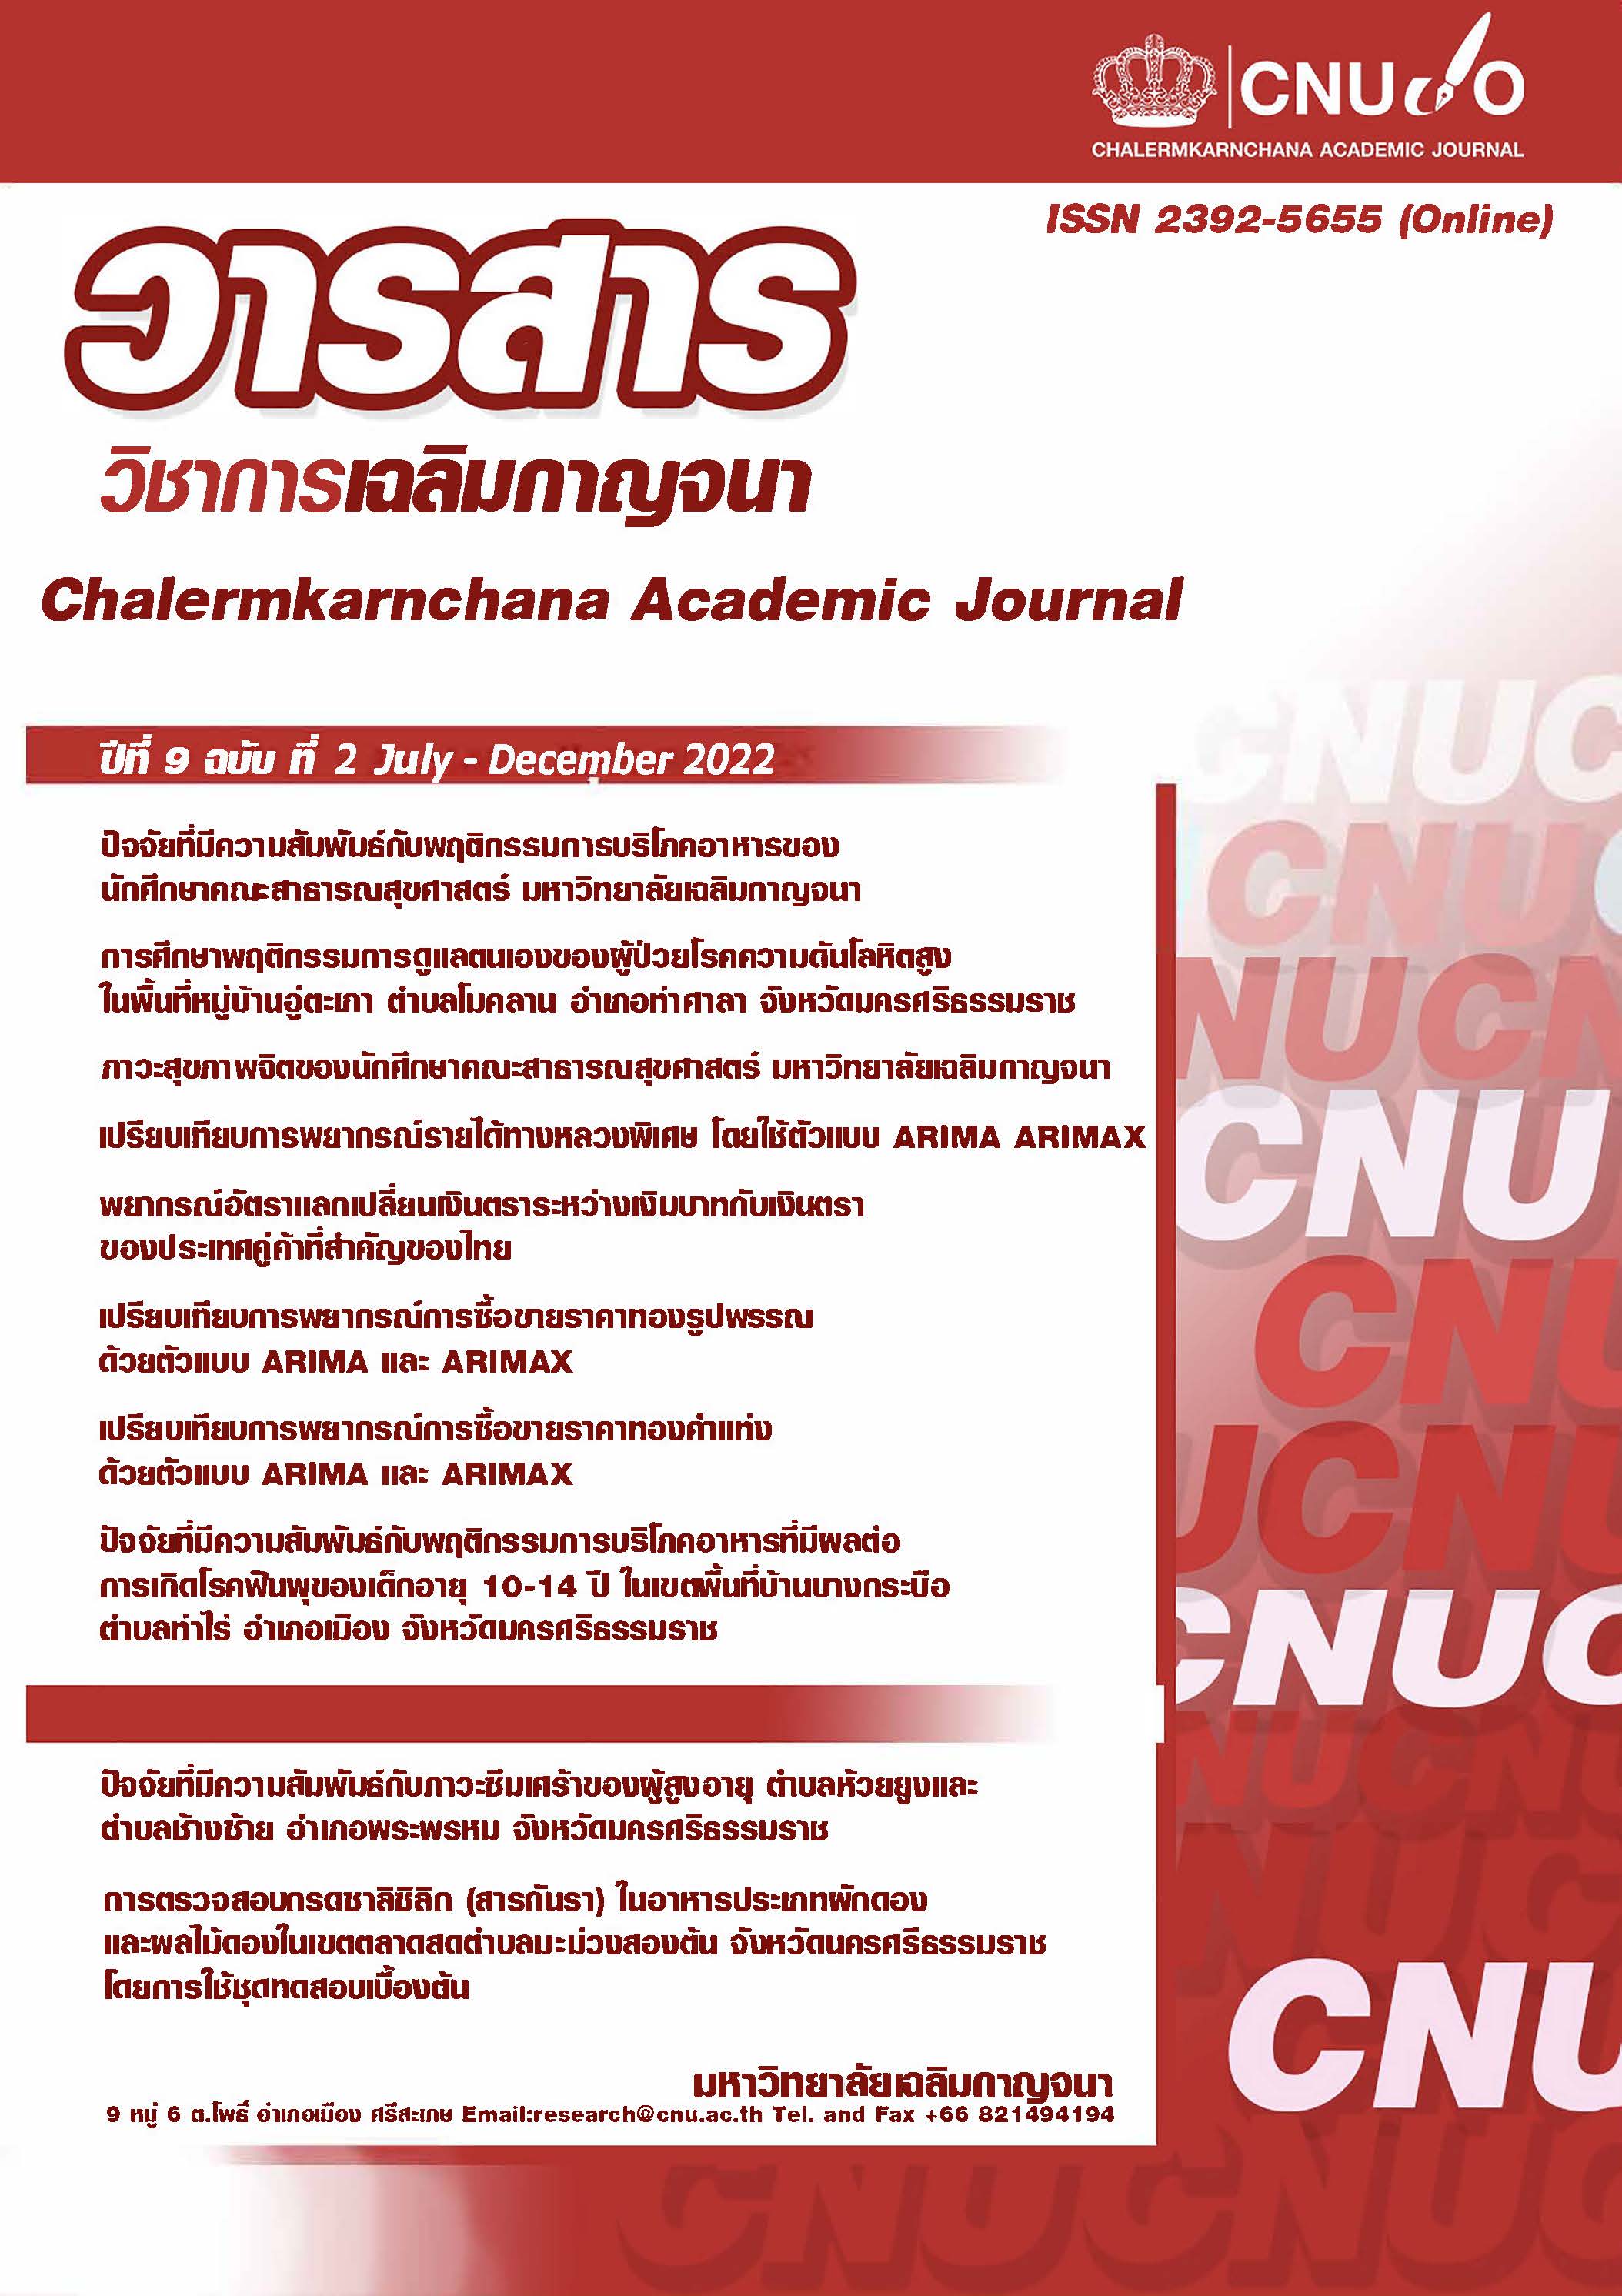
Compare Gold Bullion Trading Forecasts with ARIMA and ARIMAX Models
Keywords: the exchange rate of USD (baht), Nominal Effective Exchange Rate (NEER), SET index Leading Economic Index (LEI) and Dubai Crude Oil Price inverse index
Abstract
The purpose of this article was to find the best model by comparing the average gold price forecast of gold jewelry with the ARIMA and ARIMAX models since January 2012 to April 2023, a total of 136 months. The preliminary variable of ARIMA forecasting was the average gold price trading data of gold jewelry; the dependent variable was the trading forecasting result of the ARIMA model and forecasting with the ARIMAX model, the initial variables were trading forecast results with the ARIMA model, the exchange rate of USD (baht), Nominal Effective Exchange Rate (NEER), SET index Leading Economic Index (LEI) and Dubai Crude Oil Price inverse index. The dependent variables are trading forecast results with the ARIMAX model. MAPE, MAE, MSE, RMSE, Ljung-Box Q (18) and BIC criteria were selected from the lowest values and p-values greater than or equal to 0.05. The study found that forecasting the purchase price of gold jewelry using the ARIMA (1,1,0) model was more accurate than the model. ARIMAX (0,1,0) with MAPE equal to 2.040 %, MAE equal to 447.450, RMSE equal to 447.450, Ljung-box Q(18) equal to 6.384, BIC equal to 12.873 and p-value equal to 0.990. It means that the built-in correlation coefficient at Lag is not significantly different from zero. Forecasting the selling price of gold jewelry using the ARIMA (1,1,0) model is more accurate than the ARIMA (1,1,0) model. ARIMAX (0,1,0), with MAPE equal to 1.993%, MAE equal to 455.887, RMSE equal to 592.078, Ljung-box Q (18) equal to 6.139, BIC equal to 12.885, and p-value equal to 0.992, meaning that the built correlation coefficient at Lag is not significantly different from zero
References
บุญกอง ทะกลโยธิน และยุพาภรณ์อารีพงษ์. (2561).การเปรียบเทียบตัวแบบการพยากรณ์ราคาหุ้น โดยใช้แบบจำลองอารีมา
และอารีแม็กซ์. วารสารวิทยาศาสตร์และเทคโนโลยีหัวเฉียวเฉลิม พระเกียรติ. 4(1), 44-55
ธนาคารแห่งประเทศไทย (2566) .สถิติและข้อมูลเผยแพร่. สืบค้นจาก.https://www.bot.or.th/th/statistics.html.เข้าถึง
เมื่อ 9 มิถุนายน 2566
ธนาคารแห่งประเทศไทย (2566) . FM_FX_001_S3 อัตราแลกเปลี่ยนเฉลี่ยของธนาคารพาณิชย์ในกรุงเทพมหานคร (2545-
ปัจจุบัน).สืบค้นจากhttps://app.bot.or.th/BTWS_STAT/statistics/BOTWEBSTAT
.aspx?reportID=123&language=TH.เข้าถึงเมื่อ 9 มิถุนายน 2566
สมาคมค้าทองคำ (2566) .ราคาทองคำถัวเฉลี่ย. สืบค้นจาก.https://www.goldtraders.or.th/AvgPriceList.aspx.
เข้าถึงเมื่อ 9 มิถุนายน 2566
สิรภัทร เกาฏีระ (2564) .แนวโน้มราคาทองคำในอนาคตจะเป็นอย่างไร ในความท้าทายทางเศรษฐกิจรอบด้าน.
สืบค้นจาก.https://www.krungsri.com/th/wealth/krungsri-prime/privileges/articles/trend-gold-prices-in-future.เข้าถึงเมื่อ 9 มิถุนายน 2566
Jadhav, V., CHINNAPPA, R. B., & Gaddi, G. M. (2017). Application of ARIMA model for forecasting
Agricultural prices. Journal of Agricultural Science and Technology. 19, 981-992.
Downloads
Published
How to Cite
Issue
Section
License
Copyright (c) 2022 Chalermkarnchana Academic Journal

This work is licensed under a Creative Commons Attribution-NonCommercial-NoDerivatives 4.0 International License.


